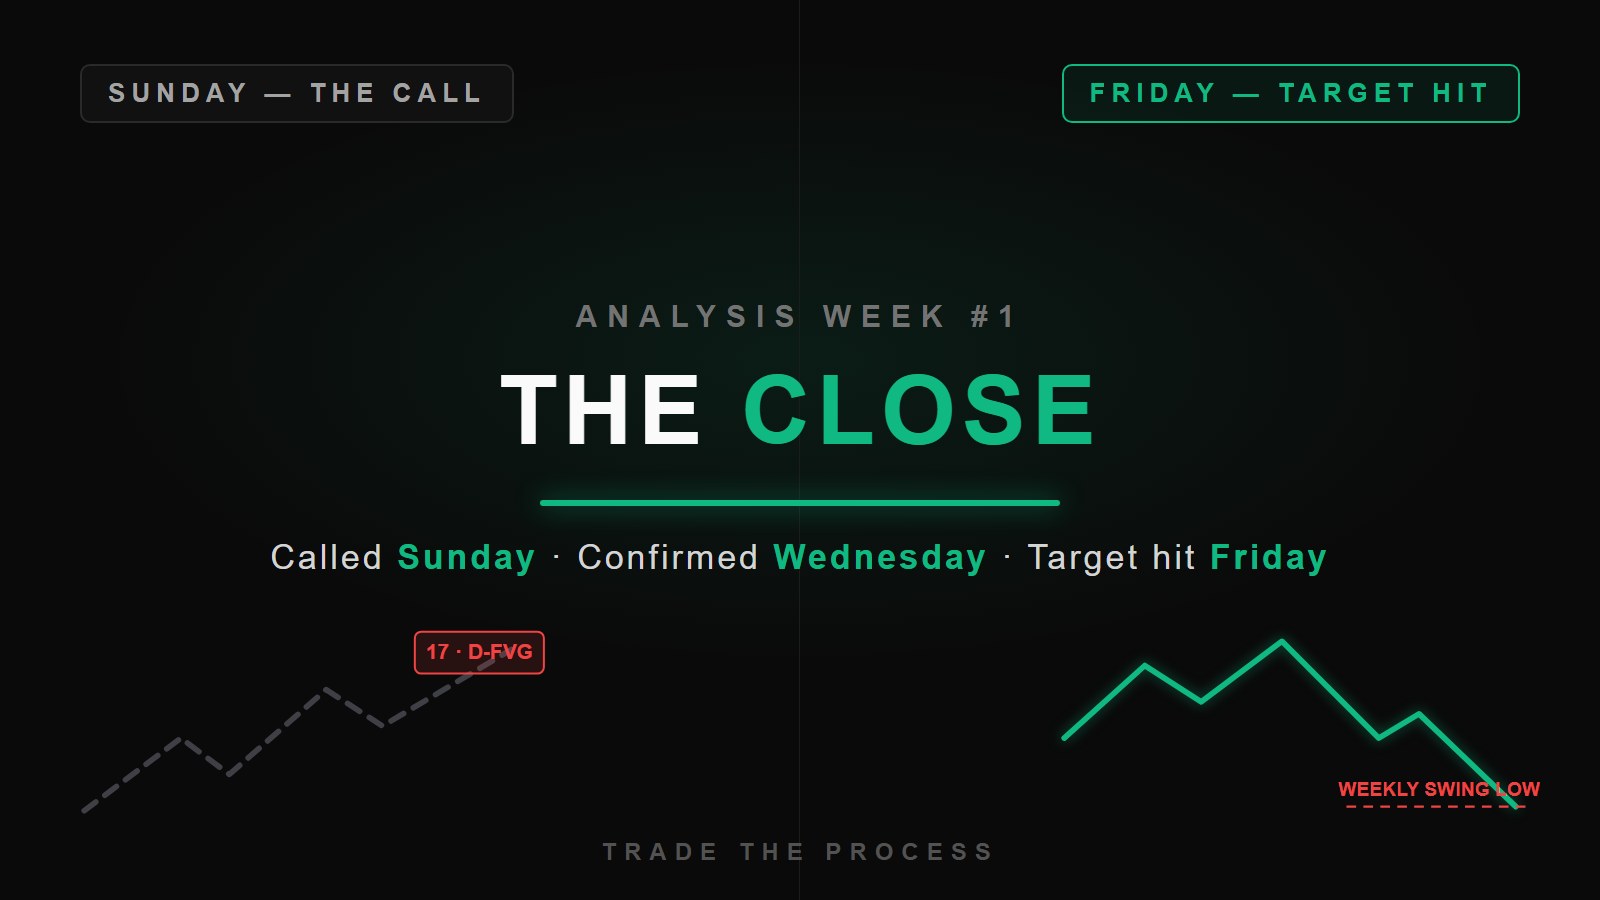
Last Friday, NQ closed at the 3 GB level. On Sunday I published my read for the week. This is how it ended.
Before — Sunday, the call
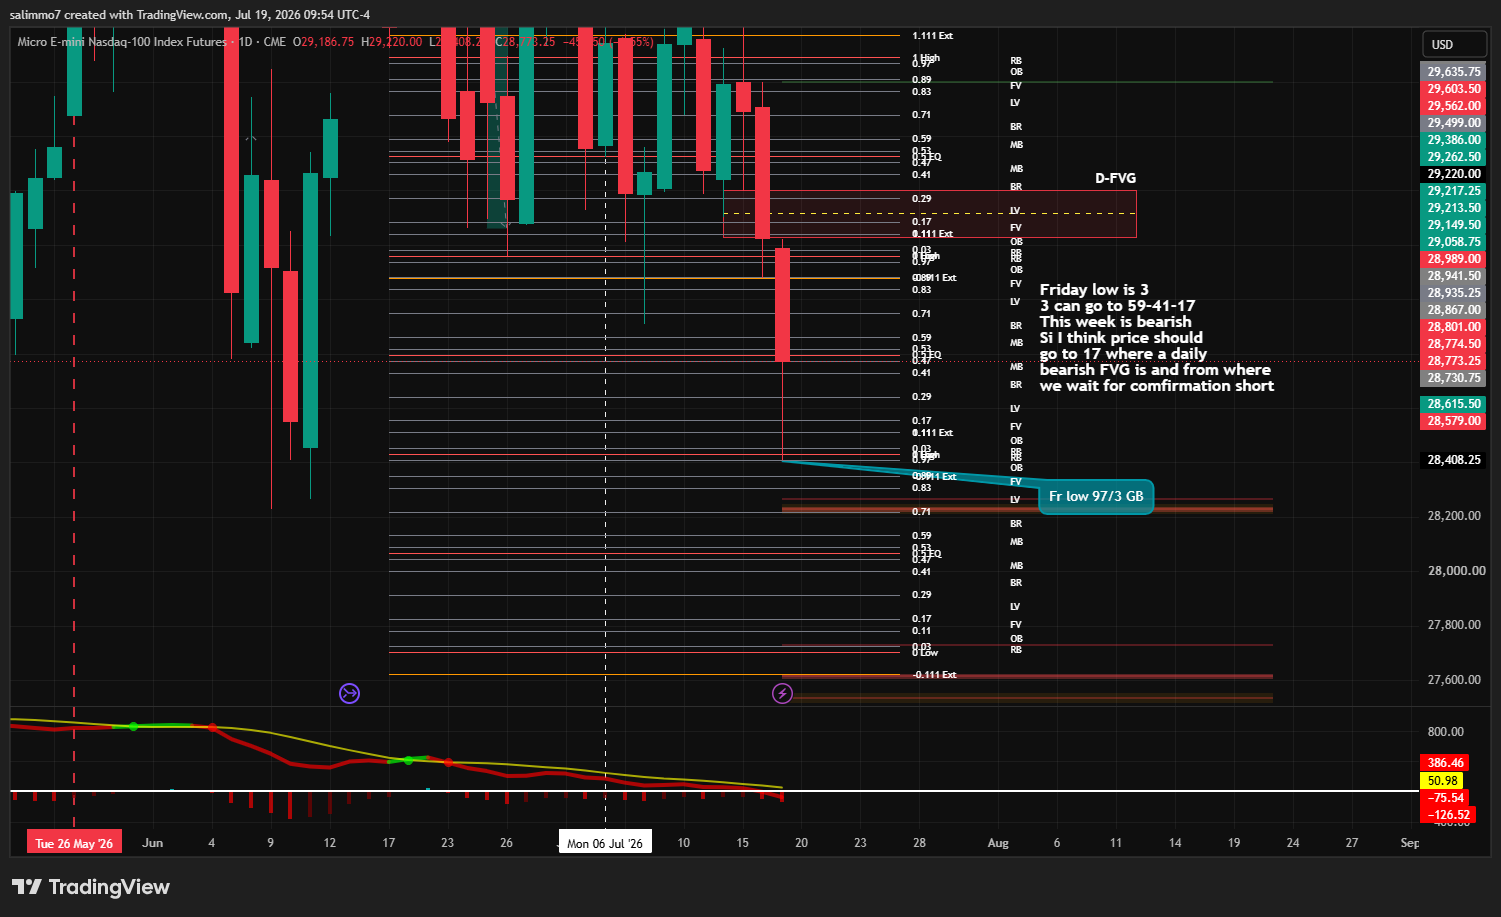
From 3, the algo path draws up: 3 → 59 → 41 → 17. My read: Monday and Tuesday push up into 17, where the bearish daily FVG sits. If I get confirmation there, I’m looking short — target, the weekly swing low.
What happened
Tuesday, price rallied straight into 17 — right into the bearish daily FVG. I posted the mid-week update the same week, so this part is timestamped too.
Wednesday night, the confirmation came: a 1-hour inversion FVG — a bullish gap that inverted — formed inside the bearish daily FVG. That was my trigger. I went short.
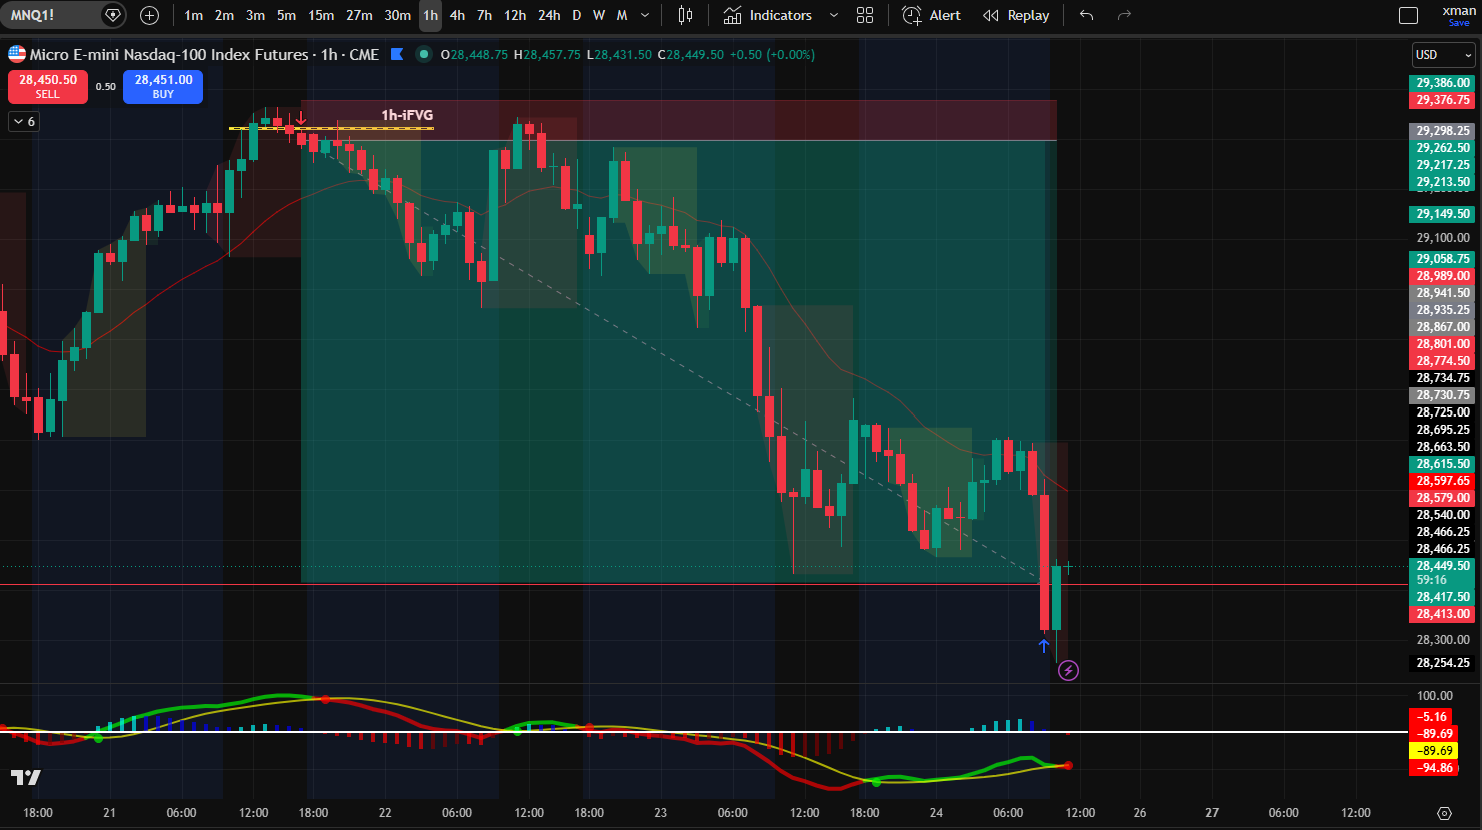
The trade itself, on the 1h: short from the inversion, target below.
After — Friday, target hit
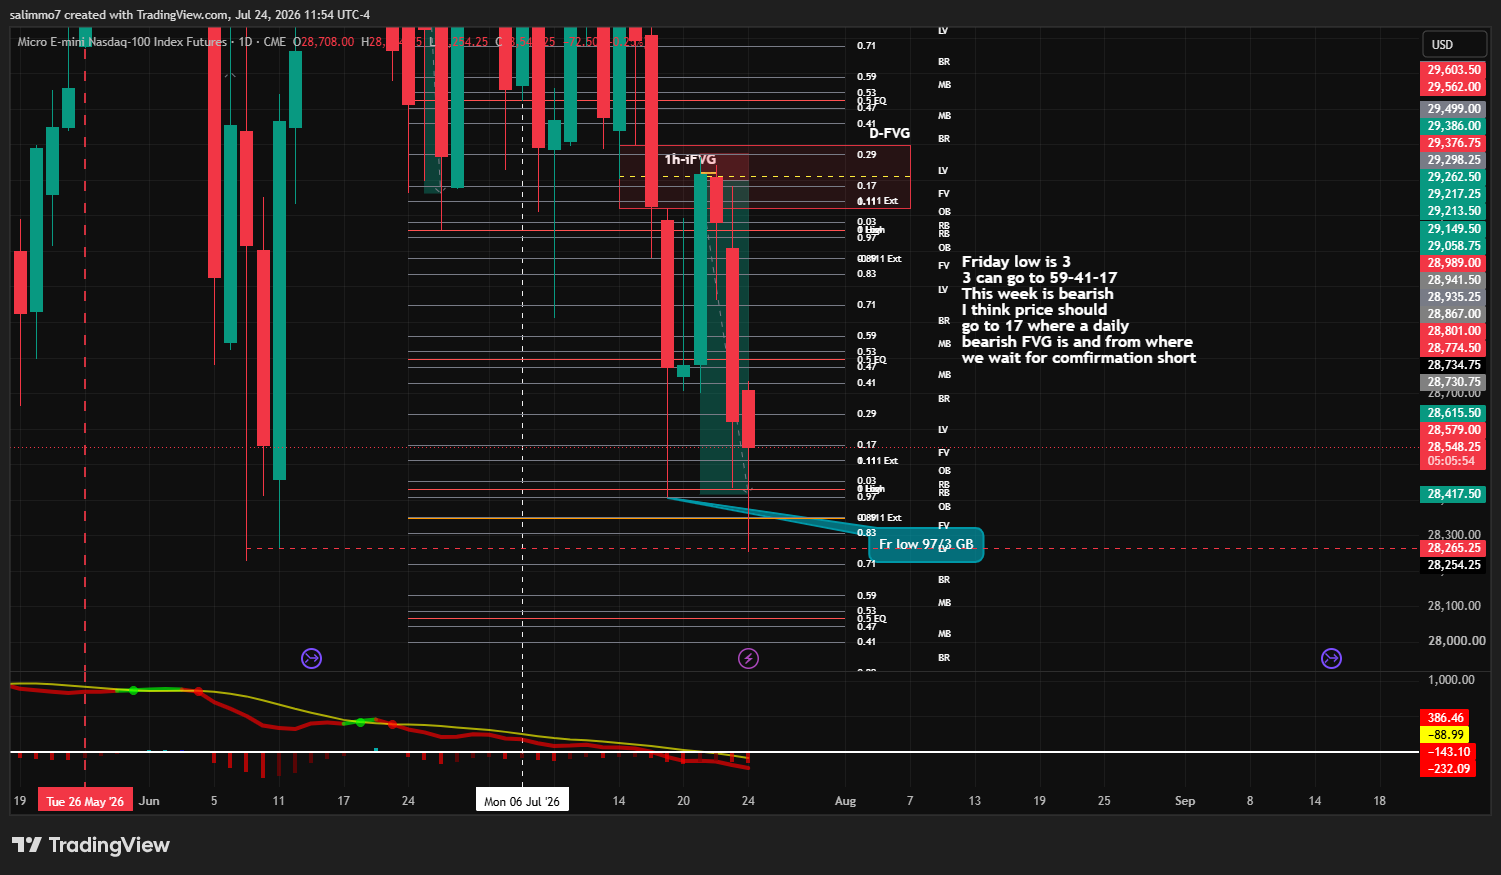
Friday, price ran into the weekly swing low. The path up, the level, the confirmation, the target down — the trade played out exactly as mapped.
Why I’m showing you this
Not because one week proves anything — it doesn’t, and I’ll show you the weeks that don’t play out too. I’m showing it because both charts are dated before the move. The call is from Sunday. The result is from Friday. Nothing here is hindsight.
The mapping behind it — the GB levels, the algo path, what counts as confirmation — is exactly what the course is built on.
And a reminder for the waitlist: at 200 traders, I record a full video breakdown walking through a week like this on the charts, for everyone on the list. If this kind of analysis helps you, share it with one trader who’d appreciate it — the buttons are on this page.
— Salim
Everything on this site is educational content, not financial advice. Trading involves substantial risk. This is my personal analysis and my personal trade — not a recommendation to take any trade.